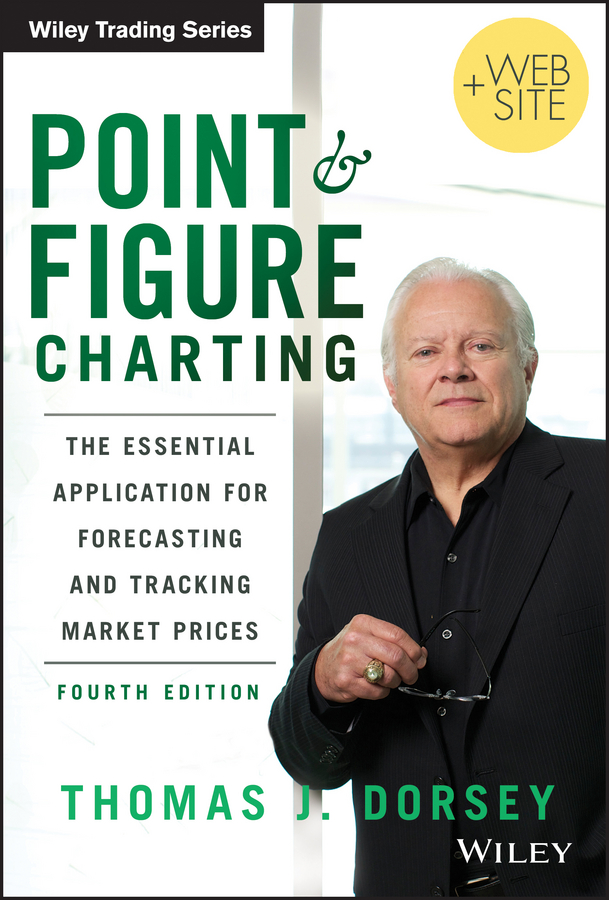
Электронная книга: Thomas Dorsey J. «Point and Figure Charting. The Essential Application for Forecasting and Tracking Market Prices»

|
An up-to-date look at point and figure charting from one of the foremost authorities in the field If you're looking for an investment approach that has stood the test of time—during both bull and bear markets—and is easy enough to learn, whether you're an expert or aspiring investor, then Point and Figure Charting, Fourth Edition is the book for you. Filled with in-depth insights and expert advice, this practical guide will help you grow your assets in any market. In this reliable resource, the world's top point and figure charting expert, Tom Dorsey returns to explain how traders and investors alike can use this classic technique—borne out of the irrefutable laws of supply and demand—to identify and capitalize on market trends. Describes, step-by-step, how to create, maintain, and interpret your own point and figure charts with regard to markets, sectors, and individual securities Explains how to use other indicators, including moving averages, advance-decline lines, and relative strength to augment point and figure analysis Reveals how to use this approach to track and forecast market prices and develop an overall investment strategy Skillfully explains how to use point and figure analysis to evaluate the strength of international markets and rotate exposure from country to country Today's investment arena is filled with a variety of strategies that never seem to deliver on what they promise. But there is one approach to investment analysis that has proven itself in all types of markets, and it's found right here in Point and Figure Charting, Fourth Edition. Издательство: "John Wiley&Sons Limited (USD)"
ISBN: 9781118662342 электронная книга Купить за 4552.77 руб и скачать на Litres |
Другие книги схожей тематики:
| Автор | Книга | Описание | Год | Цена | Тип книги |
|---|
См. также в других словарях:
Point and figure chart — A point and figure chart is used for technical analysis of securities. Unlike most other investment charts, point and figure charts do not present a linear representation of time. Instead, they show trends in price.The aim of point and figure… … Wikipedia
Australia — /aw strayl yeuh/, n. 1. a continent SE of Asia, between the Indian and the Pacific oceans. 18,438,824; 2,948,366 sq. mi. (7,636,270 sq. km). 2. Commonwealth of, a member of the Commonwealth of Nations, consisting of the federated states and… … Universalium
Economic Affairs — ▪ 2006 Introduction In 2005 rising U.S. deficits, tight monetary policies, and higher oil prices triggered by hurricane damage in the Gulf of Mexico were moderating influences on the world economy and on U.S. stock markets, but some other… … Universalium
